ggplot2 has become defacto standard in R for plotting. It is easy to produce basic plots as web is full of them. But for better control, one has to trawl through manuals, forums and numerous spam pages to get the right answer. Today, let us control the order of bars in bar plot using ggplot. Our dataset is iris. I understand that offlate, iris data set has become sensitive to use. If you do not want to use iris data, you can use mtcars data. Concepts remain the same
================================================================
## View the data
library(DT)DT:::datatable(iris)
## load the libraries
data(iris)library(ggplot2)
suppressPackageStartupMessages(library(dplyr))
library(forcats)
library(tidyr)
============================================================
Now let us do the basic plotting. We would be converting data frame (iris) from wide format (5 columns by 50 rows) into long format with three columns: Species, Type (Sepal, Petal etc) and corresponding measurement values for each type.
=================================================================
## Let us do the plotting
iris %>%
pivot_longer(-Species, names_to ="Type",values_to ="Value") %>%ggplot(aes(Species, Value, fill = Type, group=Type)) +
geom_bar(position = "dodge", stat = "identity", width = 0.7) +
theme_bw()
===============================================================
Plot looks like this:
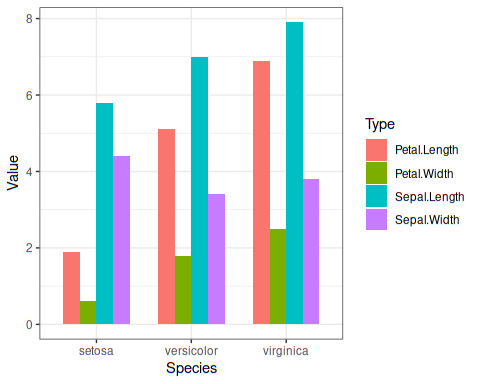
===============================================
iris %>%
pivot_longer(-Species, names_to ="Type",values_to ="Value") %>%
mutate_at(c("Type","Species"), as.factor)%>%
mutate(Type=fct_relevel(Type,"Sepal.Length","Petal.Length","Sepal.Width","Petal.Width"))%>%
ggplot(aes(Species, Value, fill = Type, group=Type)) +geom_bar(position = "dodge", stat = "identity", width = 0.7) +
theme_bw()
==================================================
plot looks like this:

Now that we plotted, inside bars as per our choice, let us do another exercise. This time, we want within each species, we would like to plot the bars in increasing value order. ggplot plots the group as per the order of the grouping variable. Since, neither species nor type (sepal, petal category) doesn’t give any information, we need to create a column to control the order of bars in the figure. For each category within each species, we take mean. Types will be drawn in the order of their means in increasing order, by default.
=========================================================
iris %>%
pivot_longer(-Species, names_to ="Type",values_to ="Value") %>%
mutate_at(c("Type","Species"), as.factor) %>%
group_by(Species,Type) %>%
mutate(mean=mean(Value))%>%
ggplot(aes(Species,Value, group=mean,fill = Type)) +
geom_bar(position="dodge", stat = "identity", width = 0.7 ) +
theme_bw()
pivot_longer(-Species, names_to ="Type",values_to ="Value") %>%
mutate_at(c("Type","Species"), as.factor) %>%
group_by(Species,Type) %>%
mutate(mean=mean(Value))%>%
ggplot(aes(Species,Value, group=mean,fill = Type)) +
geom_bar(position="dodge", stat = "identity", width = 0.7 ) +
theme_bw()
========================================================
image looks like this:

What if we want in decreasing order?
========================================================
iris %>%
pivot_longer(-Species, names_to ="Type",values_to ="Value") %>%
mutate_at(c("Type","Species"), as.factor) %>%
group_by(Species,Type) %>%
mutate(mean=mean(Value))%>%
ggplot(aes(Species,Value, group=desc(mean),fill = Type)) +
geom_bar(position="dodge", stat = "identity", width = 0.7 ) +
theme_bw()
pivot_longer(-Species, names_to ="Type",values_to ="Value") %>%
mutate_at(c("Type","Species"), as.factor) %>%
group_by(Species,Type) %>%
mutate(mean=mean(Value))%>%
ggplot(aes(Species,Value, group=desc(mean),fill = Type)) +
geom_bar(position="dodge", stat = "identity", width = 0.7 ) +
theme_bw()
=======================================================

What if we want the bars to be separated from each other?
==========================================================
iris %>%
pivot_longer(-Species, names_to ="Type",values_to ="Value") %>%
mutate_at(c("Type","Species"), as.factor) %>%
group_by(Species,Type) %>%
mutate(mean=mean(Value))%>%
ggplot(aes(Species,Value, group=desc(mean),fill = Type)) +
geom_bar(position=position_dodge(width = 0.8), stat = "identity", width = 0.7) +
theme_bw()
=========================================================
