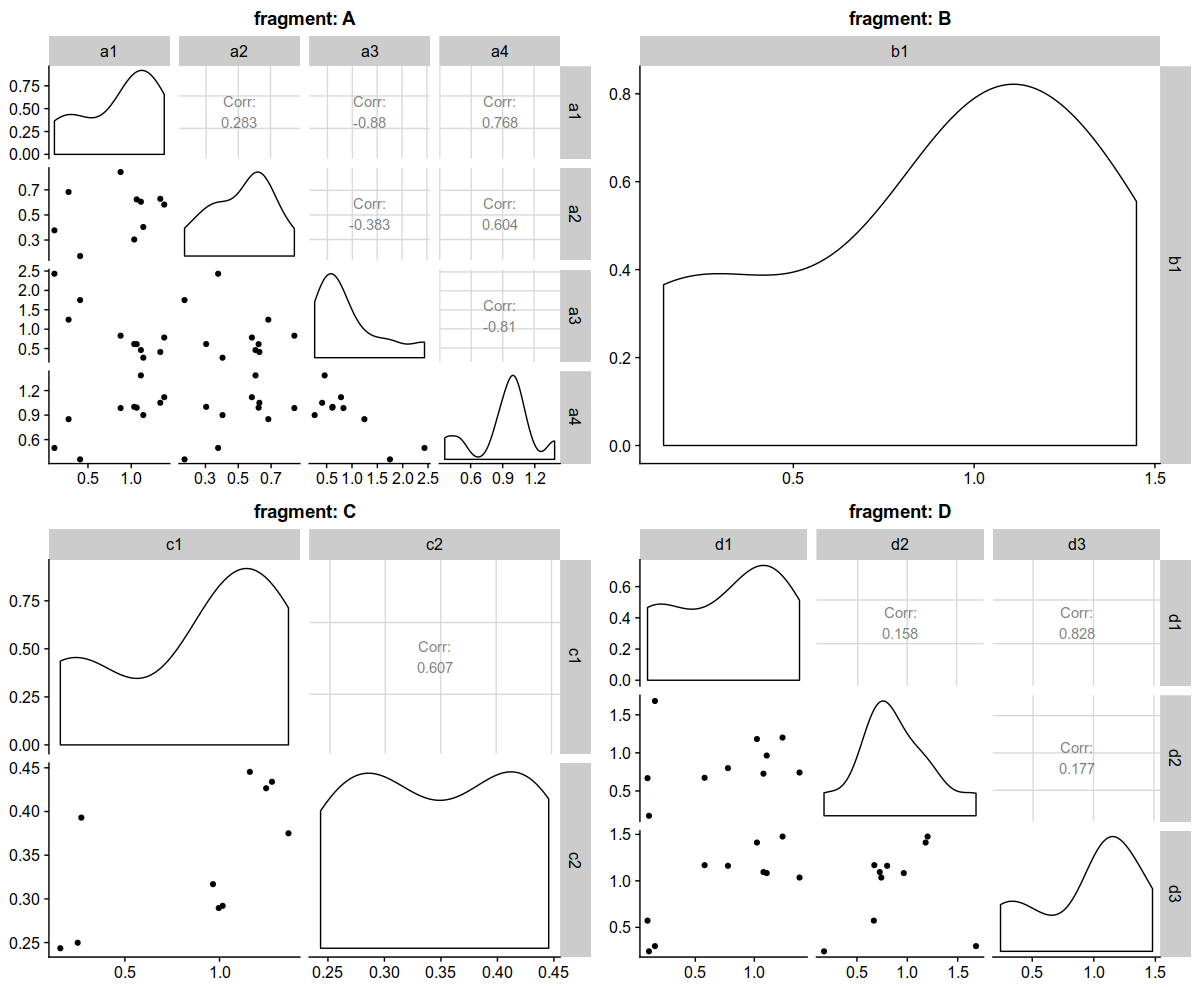
GGally package offers several plotting options and is an extension to ggplot. One of the functions in ggally is ggpairs which plots pair wise comparison graphs. If one has a single chart, then it would not a problem to save the plot. However if graphs are saved in a list and to save list of figures is challenging. Since graph already facets the data, faceting graph of graphs is not native. Let us see how to resolve this issue. Following is what we have and what we want:

=================================
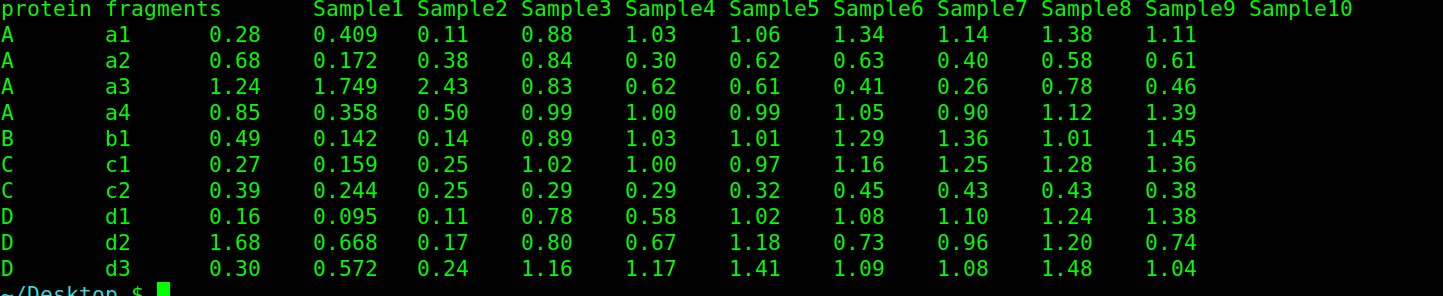
- A data frame with proteins and measurement of variable number of fragments for each protein
- Now we need to compare every fragment against every other fragment per protein.
Now that we have seen the data, let us get into action. We will do following steps using several packages.
- Load the data
- Convert wide format to long format
- Create a list with several data frames, one for each protein
- Each data frame will be converted from long format to wide format
- With in each data frame, select columns for ggpairs function and append the name of the data frame to the graph
- Save the result as individual png.
=================================
$ df1=read.csv("ggpairs_example_data.txt", stringsAsFactors = F, strip.white = T, sep="\t")
$ library(ggplot2)
$ library(dplyr)
$ library(purrr)
$ library(tidyr)
$ library(GGally)
$ p=df1 %>%
gather(k,v, -protein, -fragments) %>%
split(.$protein) %>%
map(~spread(.,fragments, v)) %>%
map(~select(.,1:ncol(.))%>%
ggpairs(3:ncol(.), title = paste0("fragment: ",unique(.[,1]))))
$ for(i in 1:length(p)){
ggsave(plot = p[[i]], file = paste0(names(p)[i],".png"), dpi = 300)
}
## Now this loop would save all the graph objects in individual files with 300 dpi resolution. Let us facet all the graphs together
$ library(cowplot)
$ plot_grid(
ggmatrix_gtable(p[[1]]),
ggmatrix_gtable(p[[2]]),
ggmatrix_gtable(p[[3]]),
ggmatrix_gtable(p[[4]]),
nrow = 2,
ncol=2)
## 4 is because the number of proteins we have in the list. Actually this can be automated and I am lazy to automate it. Will do it in future. Below is the final figure. Note that I am not posting individual figures.
======================================