Glimma package is an interactive visualization package for RNAseq data, in general. However, one can visualize any numeric data that follows required data format. Some times, user can run into an error like this: "Warning: Error in checkThat: Second argument should contain the first". This error might be due to several issues as I am unaware of the code. However, one of the fixes is furnished below with example.
Test expression data can be downloaded from here (taken from one of the Biostar posts). It is a plain text file (tab separated) as follows:
===========================================
symbol genes logFC logCPM LR PValue FDR
===========================================
ENSG00000018625 CXorf56 4.731732 7.700889 21.57148 3.408840e-06 0.005551464
ENSG00000065534 SPEN 4.131256 12.597048 19.89395 8.185875e-06 0.005551464
ENSG00000007933 DNAJC11 5.340935 5.797704 19.28277 1.127190e-05 0.005551464
ENSG00000091986 CCDC80 3.829369 11.839320 18.55905 1.647217e-05 0.005551464
ENSG00000022267 C8B 3.820883 11.532498 18.43854 1.754731e-05 0.005551464
ENSG00000007908 TEAD3 5.402253 6.162232 18.41020 1.781025e-05 0.005551464
============================================
Please note that this is a dummy data, not real data AFAIK. Let us load this run the following code to load and prune the data:
==========================================
# Loads the library
$ library(Glimma)
# Loads the data into a dataframe
$ df=read.csv("test_glimma.txt", sep="\t", strip.white = T, stringsAsFactors = F)
df
$ df=read.csv("test_glimma.txt", sep="\t", strip.white = T, stringsAsFactors = F)
df
# Convert first column to row names of the dataframe
$ row.names(df)=df[,1]
$ row.names(df)=df[,1]
# Remove the first column
$ df=df[,-1]
$ df=df[,-1]
==========================================
Now let us execute the code for interactive html page:
==========================================
$ glXYPlot(df$logFC, -log10(df$FDR), xlab="logFC",ylab="-log(FDR)",anno=df$genes)
===========================================
Now this would throw following error: "Error in checkThat(side.main, isIn(display.columns)) : Second argument should contain the first. "
Now this error has nothing to with the data frame, as I understand. This error is due to lack of another data frame that "anno" function needs and also missing, mandatory column name.
Way to address this issue is to create a data frame with the same data as above by removing all the expression data and keeping only gene names under "GeneID" column and keeping the row names same. Data frame should have same number of rows. Let us create a new data frame. Please compare with the original data frame (df).
==============================================
$ ga=data.frame(GeneID=df[,1], row.names=row.names(df))
==============================================
Now execute the code as follows:
==============================================
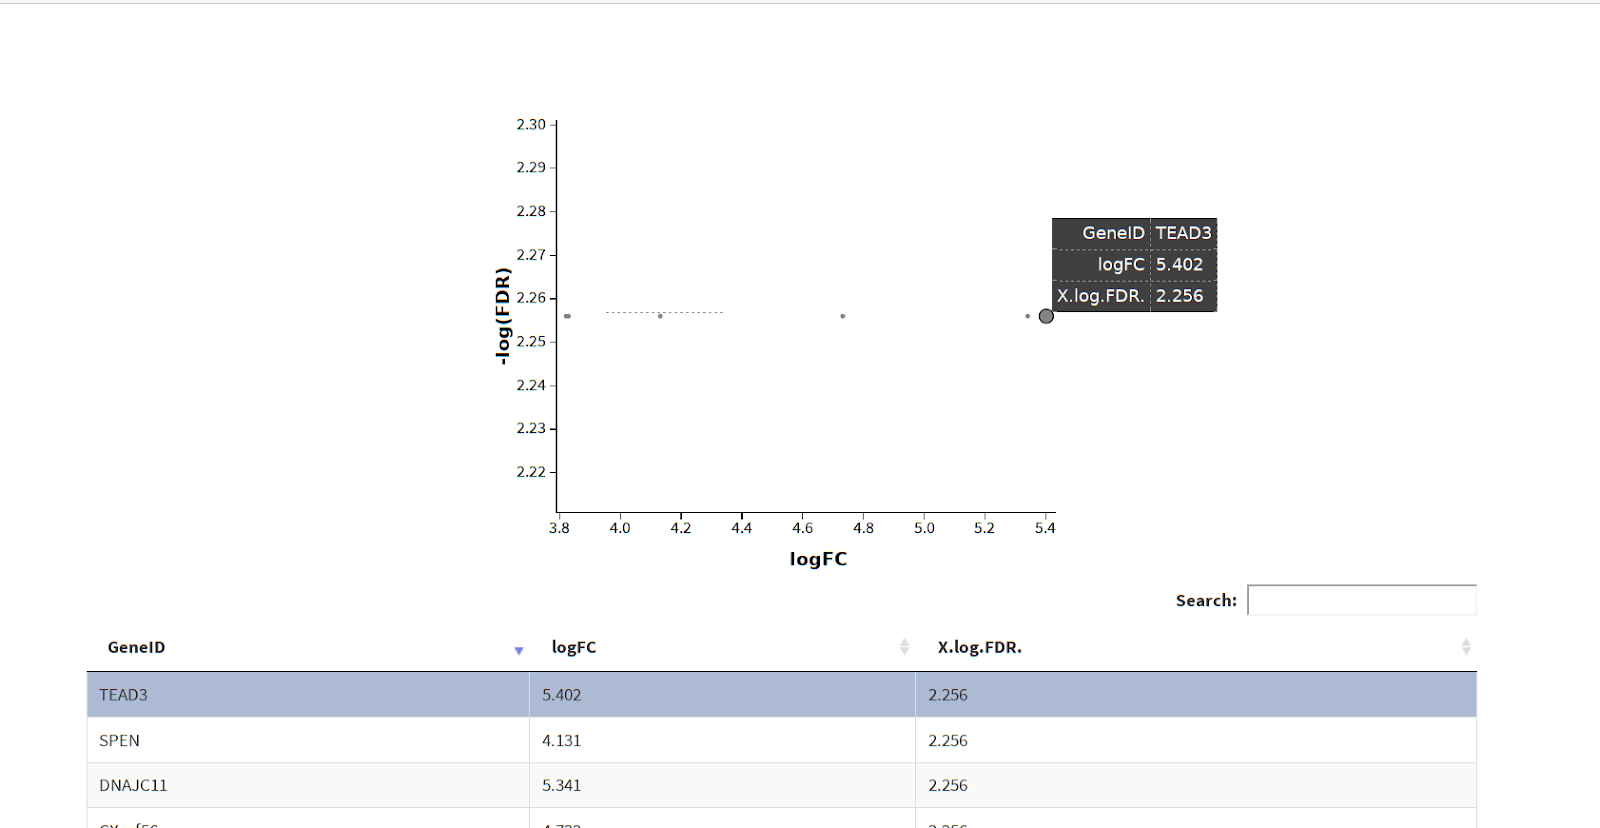
$ glXYPlot(df$logFC, -log10(df$FDR), xlab="logFC",ylab="-log(FDR)",anno=ga)
==============================================
==============================================
This would produce interactive html plot as shown below in image:
Note:
- In Firefox (v 72), at first html table would look empty. Sort the Gene ID column, all the values appear.
- To use the status function, you need to convert the boolean filter to numeric values (eg. status=as.numeric(df$FDR <= 0.05)).