In R, when we import chromosome information, if we are not careful, levels of the imported chromosomes are not naturally sorted. This would effect the graphs some times. Following is an example:
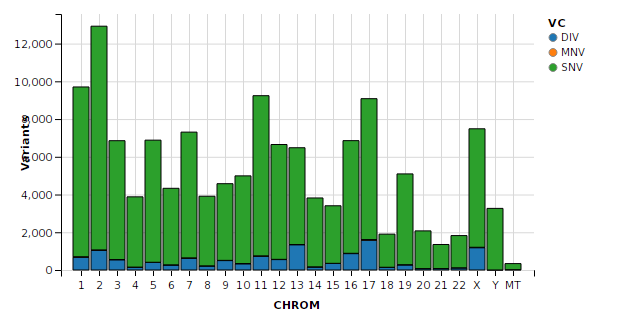
 Please note that order (sort) of the chromosome names is correct, but their levels are incorrectly sorted. This would effect the graphs produced some times. Example image is given below:
 Note the order of chromosomes on X-axis. Chromosomes (CHROM) are sorted numerically, not natural.
Following is the tip to natural sort levels as well.
Command:
<Chromosome Column> in data frame <- factor(Chromosome Column, levels=c(1:22,"X","Y","MT")) # assuming that X, Y and MT are present in the dataframe.
Example: clinvar$CHROM <- factor(clinvar$CHROM, levels=c(1:22,"X","Y","MT"))
Levels before and after running the command:
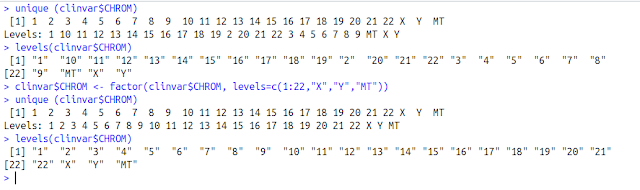

Note the order of chromosomes. Now they make biological sense.


Following is the tip to natural sort levels as well.
Command:
<Chromosome Column> in data frame <- factor(Chromosome Column, levels=c(1:22,"X","Y","MT")) # assuming that X, Y and MT are present in the dataframe.
Example: clinvar$CHROM <- factor(clinvar$CHROM, levels=c(1:22,"X","Y","MT"))
Levels before and after running the command:
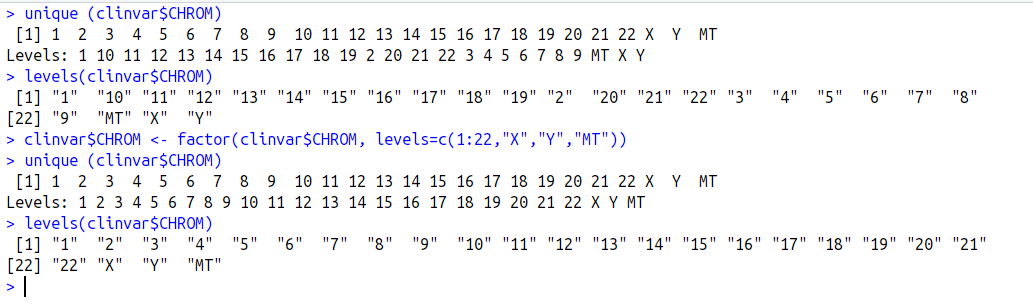
Note that levels order changed after running the command. Image produced would be as given below: