Interactome project aims to be one stop solution for PPI (protein-protein interaction) networks for researchers. Interactome project for humans and other model organisms is hosted by CCSB. Researcher can use interactome search engine to look for interactions and the search engine offers the user to export the data in excel format. However, exported data is not in excel format, but it is in csv format. After downloading the data, please use following script to generate networks and the script is derivative of igraph scripts in rbloggers.
##########################################
## load igraph library
library(igraph)
## read excel file exported from human interactome database
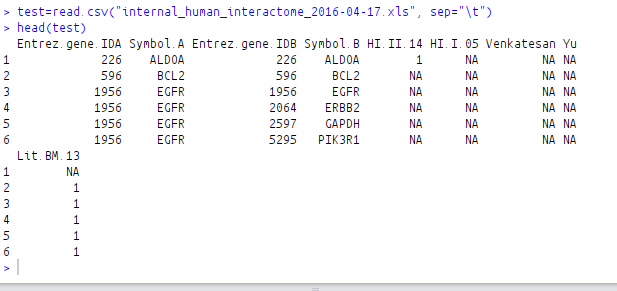
test=read.csv("internal_human_interactome_2016-04-17.xls", sep="\t")
## View the first few values
head(test)
## shuffle the columns
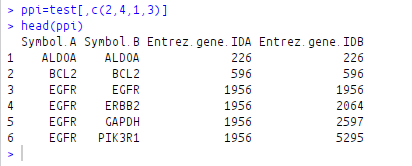
ppi=test[,c(2,4,1,3)]
## View the first few values of shuffled columns
head(ppi)
## Create a data frame for graphs
gg=graph.data.frame(ppi)
## interactive plot using tk
tkplot(gg1,
layout = layout.fruchterman.reingold,
vertex.label = V(gg)$name,
vertex.label.color= "black",
edge.arrow.size=0,
edge.curved=FALSE
)
############################################
Before shuffling the columns:
After shuffling the columns:
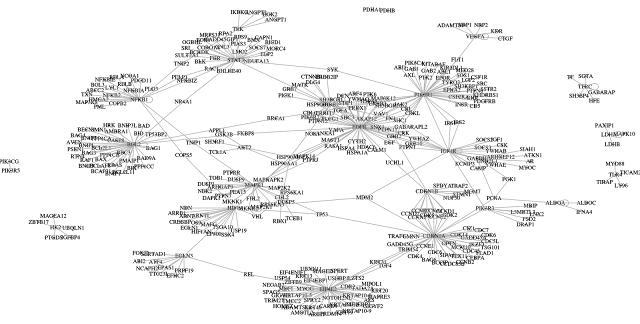
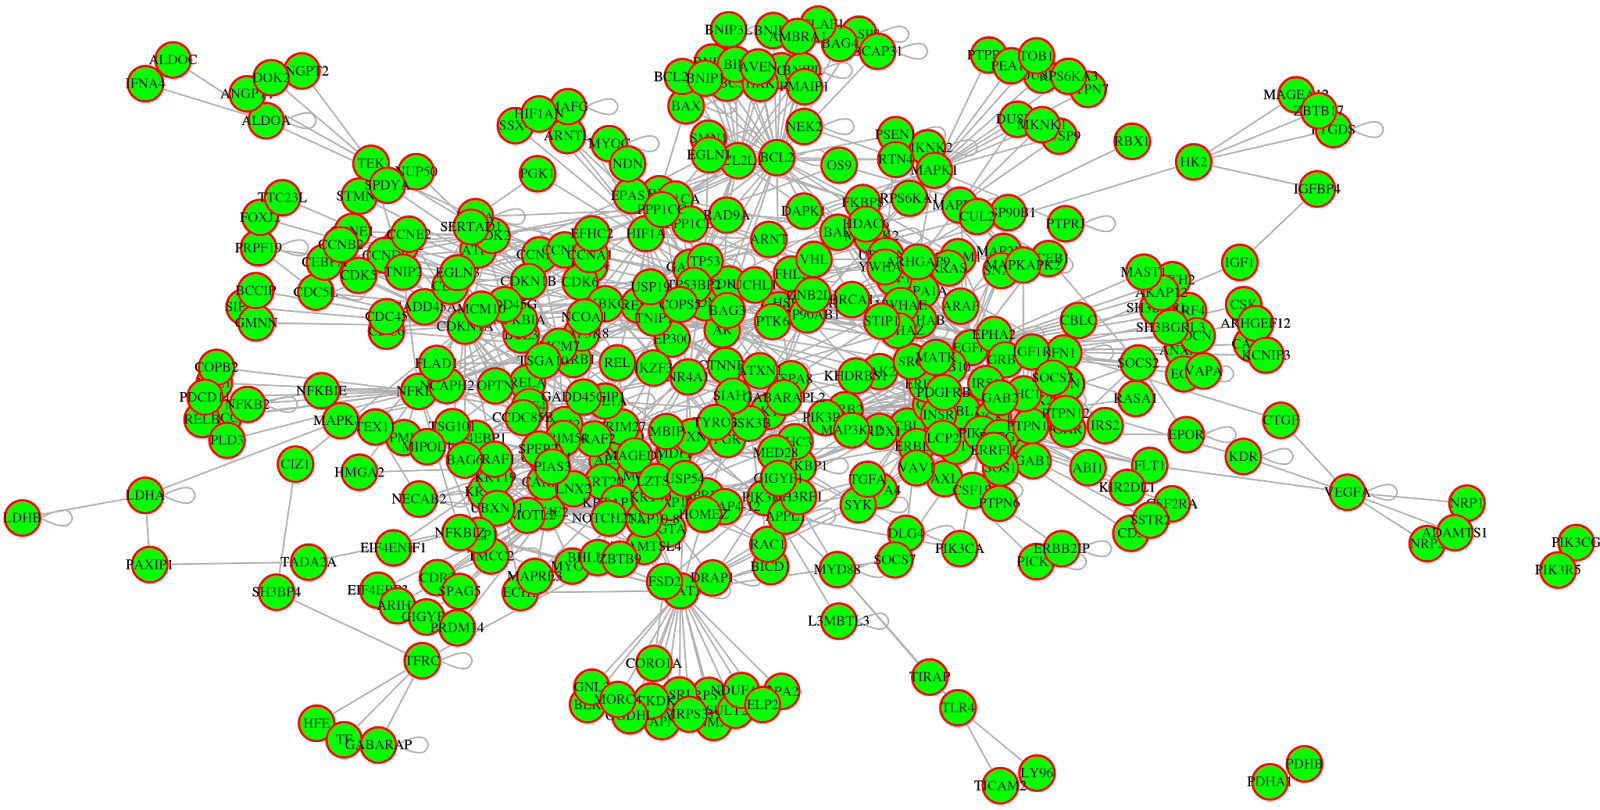
Example exported picture from interactive plot: Please note that tkplot allows the user to export images as eps only. Use convert (from image magick package) to convert images from eps to png.
Example exported images: (Here the vertex size is reduced to 1 pixel in interactive tkplot)
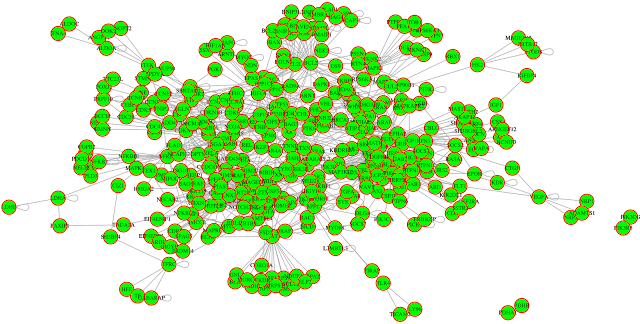
Convert eps files to png files:
$ convert -density 300 interactions.eps interactions.png
Above script converts interactions.eps (input file) to interactions.png (output file) with 300dpi (high resolution pic)
##########################################
## load igraph library
library(igraph)
## read excel file exported from human interactome database
test=read.csv("internal_human_interactome_2016-04-17.xls", sep="\t")
## View the first few values
head(test)
## shuffle the columns
ppi=test[,c(2,4,1,3)]
## View the first few values of shuffled columns
head(ppi)
## Create a data frame for graphs
gg=graph.data.frame(ppi)
## interactive plot using tk
tkplot(gg1,
layout = layout.fruchterman.reingold,
vertex.label = V(gg)$name,
vertex.label.color= "black",
edge.arrow.size=0,
edge.curved=FALSE
)
############################################
Before shuffling the columns:

After shuffling the columns:

Example exported picture from interactive plot: Please note that tkplot allows the user to export images as eps only. Use convert (from image magick package) to convert images from eps to png.
Example exported images: (Here the vertex size is reduced to 1 pixel in interactive tkplot)

Convert eps files to png files:
$ convert -density 300 interactions.eps interactions.png
Above script converts interactions.eps (input file) to interactions.png (output file) with 300dpi (high resolution pic)