qPCR/RT-PCR is a regularly used quantification method in expression studies. Quantitation of transcripts (mRNA/miRNA) often involves a value known as cT for each transcript (in both, case and control samples) and a method called ddct. ddct method is explained in the paper authored by K J Livak and T D. Schmittgen. The same method is implemented in R/Bioc package called "ddCt". ddCt package accepts several formats including SDS from SA Biosciences.
In this note, I will explain calculating expression levels using tab separated values. For this, I have used example data provided by ddCt package. Please note that example data provided by ddCt package is in SDS format. SDS formatted files are text files with extra header information and lots of other values.
I extracted data from these SDS files (as they are simple text files with extra information) and calculated differential expression. Later I compared output ( values and graphs) from the script using tab separated values with that from script provided by ddCt manual. Both are identical (and they should be). ddCt manual provides ddct algorithm and example script.
script used by ddCt package (source: rtPCR.R in .R/library/ddCt/doc/ folder on linux) ( I removed the comments)
+++++++++++++++++++++++++++++++++++++++++
library(Biobase)
library(lattice)
library(RColorBrewer)
library(ddCt)
datadir <- function(x) system.file("extdata", x, package="ddCt")
savedir <- function(x) file.path(tempdir(), x)
file.names <- c(datadir("Experiment1.txt"),datadir("Experiment2.txt"))
info <- datadir("sampleData.txt")
warningFile <- savedir("warnings.txt")
name.reference.sample <- c("Sample1", "Sample2")
name.reference.gene <- c("Gene2")
CtData <- SDMFrame(file.names)
sampleInformation <- read.AnnotatedDataFrame(info,header=TRUE, row.names=NULL)
result <- ddCtExpression(CtData,
calibrationSample=name.reference.sample,
housekeepingGene=name.reference.gene,
sampleInformation=sampleInformation,
warningStream=warningFile)
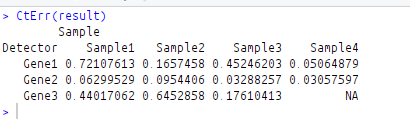
CtErr(result)
br <- errBarchart(result)
print(br)
++++++++++++++++++++++++++++++++++++++++++++++++++++
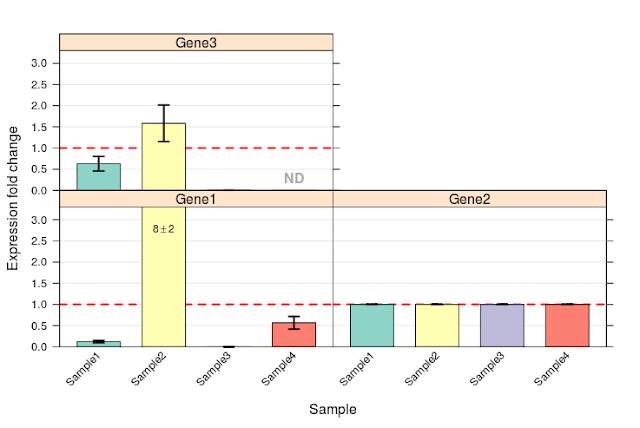
Error bar chart is given below:
 Error of all replicates are as follows:
 Now that we have output from ddCt package example script using SDS files. SDS files are Experiment 1.txt and Experiment 2. txt. Sample information is in sampleData. txt. Please note that the example files are located in extdata folder of ddCt package (for eg. on linux: /home/<user name>/.R/library/ddCt/extdata).
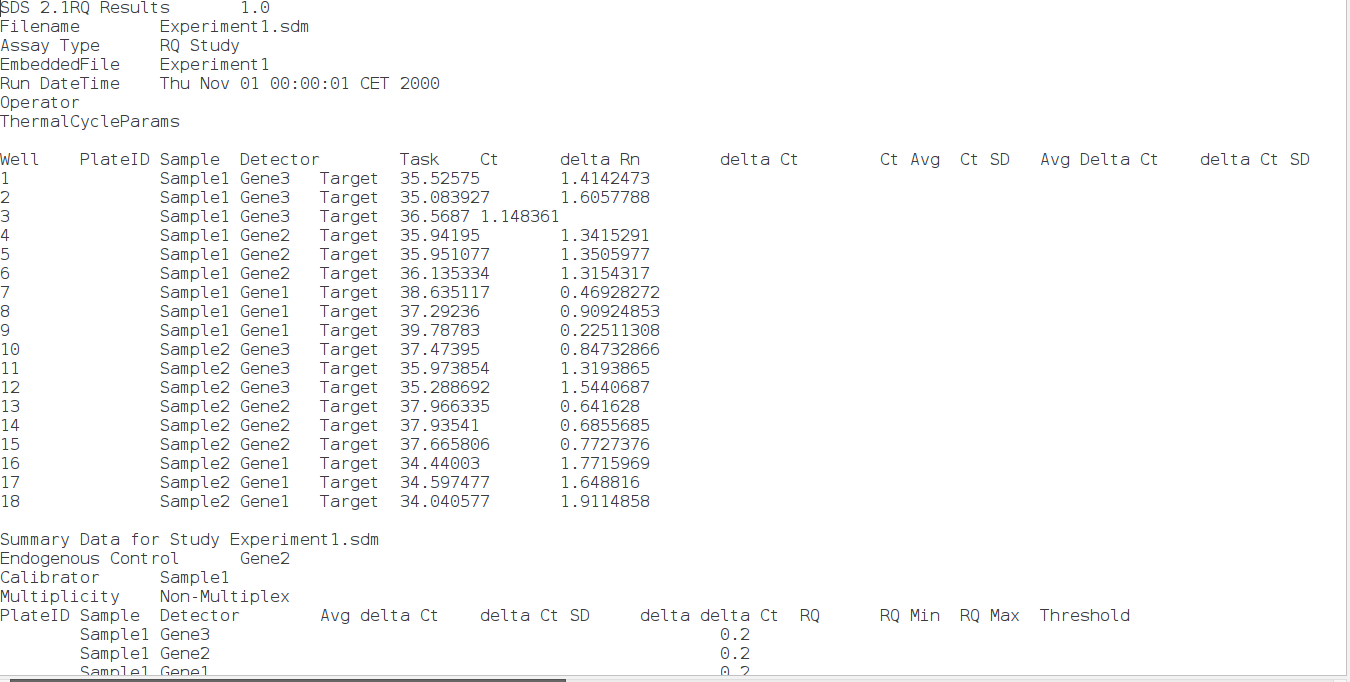
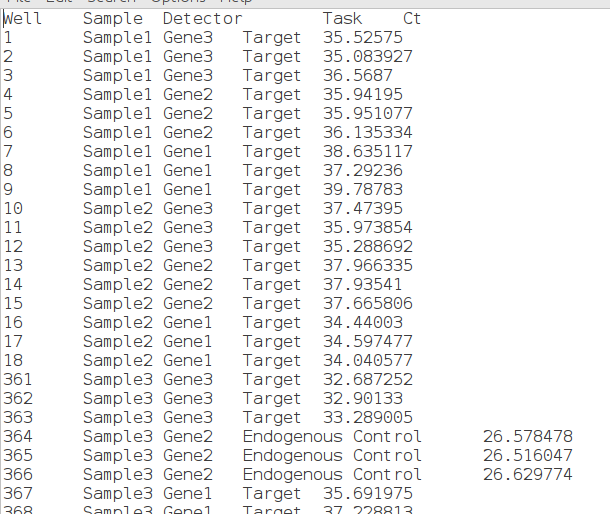
I took the experimental values from these SDS files and stored them in tab separated single file. Values I took are: Well, Sample, Detector, Task, Ct. Well column contains each well number, Sample column contains Sample number, Detector column contains name of the gene, take column contains nature of the transcript (if it is a target or a control) and ct column contain CT values.
SDS file (experiment1.txt)


R script for calculating differential expression:
Please note that sample information is not modified and is taken as such from sampleData.txt.
++++++++++++++++++++++++
## load biobase and ddct packages
library(Biobase)
library(ddCt)
## Read tab separated file and do not convert strings into factor
all.samples1=read.delim("exp.txt", stringsAsFactors = F)
## structure of object all.samples1
str(all.samples1)
## Convert values in ct column to numeric values from character values
all.samples1$Ct=as.numeric(all.samples1$Ct)
## convert in to a data frame acceptable to ddct
all.samples2=InputFrame(all.samples1)
## View the values
View(all.samples2)
## Read and store the sample information
sampleInformation <- read.AnnotatedDataFrame("sampleData.txt",header=TRUE, row.names=NULL)
## View the imported sample information
sampleInformation
## calculate the differential expression
result=ddCtExpression(all.samples2, calibrationSample=c("Sample1", "Sample2"), housekeepingGenes="Gene2", sampleInformation = sampleInformation)
## View the error in replicates
CtErr(result)
## View the out put as bar chart
errBarchart(result)
+++++++++++++++++++
View expression data as bar chart:

This output too, matches with that from example script provided by ddCt package.
To conclude, user can use tab separated experimental data to quantitate transcripts using ddCt package.
In this note, I will explain calculating expression levels using tab separated values. For this, I have used example data provided by ddCt package. Please note that example data provided by ddCt package is in SDS format. SDS formatted files are text files with extra header information and lots of other values.
I extracted data from these SDS files (as they are simple text files with extra information) and calculated differential expression. Later I compared output ( values and graphs) from the script using tab separated values with that from script provided by ddCt manual. Both are identical (and they should be). ddCt manual provides ddct algorithm and example script.
script used by ddCt package (source: rtPCR.R in .R/library/ddCt/doc/ folder on linux) ( I removed the comments)
+++++++++++++++++++++++++++++++++++++++++
library(Biobase)
library(lattice)
library(RColorBrewer)
library(ddCt)
datadir <- function(x) system.file("extdata", x, package="ddCt")
savedir <- function(x) file.path(tempdir(), x)
file.names <- c(datadir("Experiment1.txt"),datadir("Experiment2.txt"))
info <- datadir("sampleData.txt")
warningFile <- savedir("warnings.txt")
name.reference.sample <- c("Sample1", "Sample2")
name.reference.gene <- c("Gene2")
CtData <- SDMFrame(file.names)
sampleInformation <- read.AnnotatedDataFrame(info,header=TRUE, row.names=NULL)
result <- ddCtExpression(CtData,
calibrationSample=name.reference.sample,
housekeepingGene=name.reference.gene,
sampleInformation=sampleInformation,
warningStream=warningFile)
CtErr(result)
br <- errBarchart(result)
print(br)
++++++++++++++++++++++++++++++++++++++++++++++++++++
Error bar chart is given below:

I took the experimental values from these SDS files and stored them in tab separated single file. Values I took are: Well, Sample, Detector, Task, Ct. Well column contains each well number, Sample column contains Sample number, Detector column contains name of the gene, take column contains nature of the transcript (if it is a target or a control) and ct column contain CT values.
SDS file (experiment1.txt)
Text (data) file with combined data from experiment1.txt and experiment 2.txt. Combined data is name exp.txt.
R script for calculating differential expression:
Please note that sample information is not modified and is taken as such from sampleData.txt.
++++++++++++++++++++++++
## load biobase and ddct packages
library(Biobase)
library(ddCt)
## Read tab separated file and do not convert strings into factor
all.samples1=read.delim("exp.txt", stringsAsFactors = F)
## structure of object all.samples1
str(all.samples1)
## Convert values in ct column to numeric values from character values
all.samples1$Ct=as.numeric(all.samples1$Ct)
## convert in to a data frame acceptable to ddct
all.samples2=InputFrame(all.samples1)
## View the values
View(all.samples2)
## Read and store the sample information
sampleInformation <- read.AnnotatedDataFrame("sampleData.txt",header=TRUE, row.names=NULL)
## View the imported sample information
sampleInformation
## calculate the differential expression
result=ddCtExpression(all.samples2, calibrationSample=c("Sample1", "Sample2"), housekeepingGenes="Gene2", sampleInformation = sampleInformation)
## View the error in replicates
CtErr(result)
## View the out put as bar chart
errBarchart(result)
+++++++++++++++++++
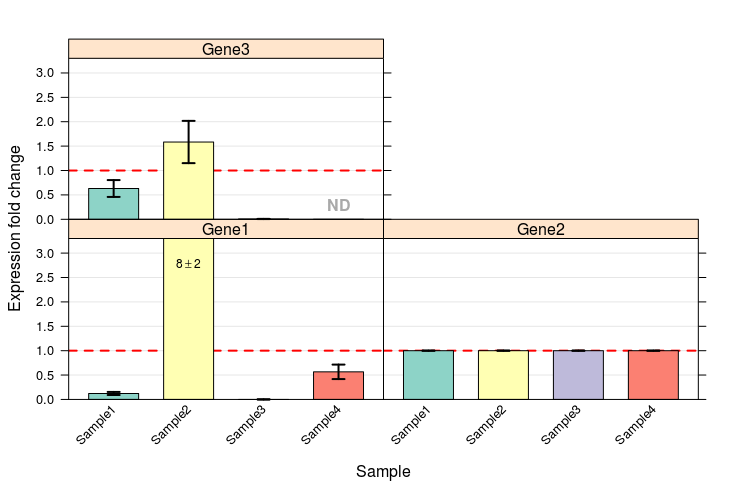
View expression data as bar chart:

This image (output from tsv file) is identical to image from SDS formatted data above.
Error values across replicates:
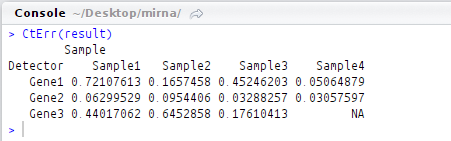
This output too, matches with that from example script provided by ddCt package.
To conclude, user can use tab separated experimental data to quantitate transcripts using ddCt package.