Transcriptome is dynamic and measurement of transcriptome is fraught with several technical and biological hurdles. First en masse arrays to study transcriptome were 3' IVT arrays, followed by exon arrays. However, out put from these technologies was not satisfactory enough to understand transcriptome in full. Advances in sequencing technologies pushed transcriptome data analysis further by introducing RNA-seq. RNA-seq has added advantage that it is possible to study variations as well in coding regions (mostly). This added advantage made it attractive for biologists to go past WGS and WES to study biological functions. In addition, advances in microRNA (part of transcriptional control machinery) studies made it possible to understand dynamics of cell, organ and organisms. However, still there is necessity in technology advancements to connect the dots between genome (and exome), transcriptome (RNA-mRNA, miRNA, siRNA etc), proteome and metabolome.
In general, RNAseq is cumbersome as RNA is not as stable as DNA and lots of experimental care is to be taken for tissue storage, RNA extraction, RNA storage and cDNA conversion. I am side stepping all the above mentioned steps till sequencing (all the bench work). Following are few necessary steps in RNA seq data analysis.
General steps in RNA seq data analysis:
1) Data qc and pruning. QC and pruning are very important steps that can throw the entire results off, if they are not done proper. Following steps may be necessary to cull noise from data.
- QC (Fastqc tool)
- Adaptor removal
- Trimming of reads
- Read Quality trimming
- K-mer coverage trimming
- K-mer coverage normalization
There are several tools to perform steps 2-5. One of the tools I use for this is cutadapt. QC must be done before and after pruning to check if pruning lead to meaningful noise reduction.
2) Data processing (alignment and post alignment pruning)
- Alignment (Reference based and denovo assembly)
- Differential gene expression (post alignment)
- Variant calling (post alignment)
There are several tools available
for alignment, post alignment processing (indexing, sorting,
quantification, normalization of reads) and subsequent downstream
processing (variant calling, Differential gene expression and meta
analysis).
3) Meta analysis
Meta analysis varies depending on the end point of the study. Meta analysis for variant calling pipeline differs significantly from DE pipeline. They will be explained in later notes in this blog.
4) Plots and reports
As much as data analysis, plots are very import part of data analysis to understand, prune, analyze, present and publish results. This part will be taken care of, during pipeline execution.
In following notes, I would outline variant calling, differential gene expression using multiple methods (pipelines) linked to dedicated pipeline blogs. Following are the pipelines that would be explained:
1) Variant calling
This pipeline is outlined here as bpipe within this blog.
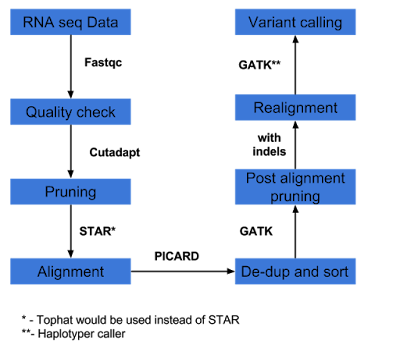
2) Variant calling as per GATK best practices workflow, as outlined here. Instead of suggested RNASTAR aligner, example uses Tophat aligner. In brief, GATK best practice is as outlined below and the bash script for executing entire pipe line is given here.
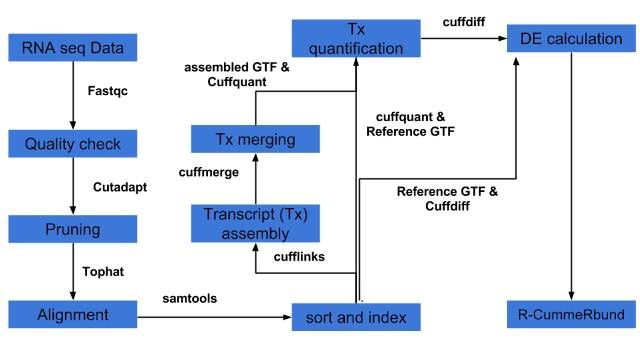
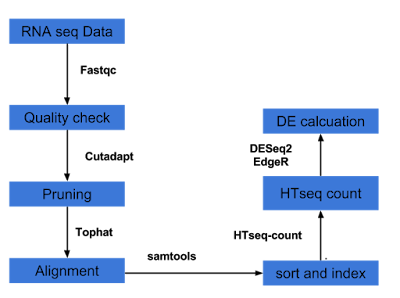
3) Differential expression analysis can be done several ways of which pipeline involving Tuxedo suite (Tophat, cufflinks, cuffdiff, cummeRbund) is one of the popular pipelines. The other pipelines involve HTseq and packages in R such as DESeq2, EdgeR etc.
Tuxedo pipeline is well explained here and is in short represented below. An example tuxedo pipeline in bash script (combined with R script) is provided here :
Several analysts forego tuxedo pipeline, instead prefer Htseq and DESeq2/EdgeR pipeline for DE calculation. It is outlined below and a bash script with R script within is provided here for this pipeline.


