Treemapping can be used in visualization of gene expression data in fact any data with more than one type of value. For eg. A probe (gene) can have two values: fold change and p-value. Heat maps are different from treemaps. While heat maps show overall trends in fold change, treemaps can show two at a time.
Treemap consists of rectangles and rectangle size and color can be controlled. For eg. rectangle size can be number of genes in pathway and color can be their fold change. Larger the rectangular size, more is it's significance.
Minimal format for gene expression treemap is:
column 1: list of genes/entities whose p-values and fold changes are to displayed
column 2: log scaled significance values
Column 3: Fold change
here is an example file that can be downloaded from : https://drive.google.com/file/d/0B0MpwluEDxNublFydFdqNjd5djg/edit?usp=sharing
This file is obtained after analyzing the data from GSE8771 and columns in this file are: Probe, Genesymbol, foldchange, ttest, log_tttest, Biological process, pathway.
Requirements:
1) treemap package is installed in R/bioconductor
2) File mentioned above is, unzipped and loaded in R/bioconductor.
Code to load above file in R/bioconductor:
$ library(treemap)
$ tm=read.table("pw_en.txt", sep="\t", header=TRUE)
Scenario 1: User wants to see statistically significant pathway and genes within the pathway
code:
$ treemap(tm, index=c("pathway","Genesymbol"), type="comp", vSize="log_tttest", vColor="foldchange", title="Pathway Enrichment")
index = box should be drawn for which column(s)?
vSize = box size
vColor= box color
comp= relative scale
In the example, R/Bioc will draw most significant pathways and size of each rectangle is dependent on it's statistical score and color of the box is dependent on fold change of each gene.
Image generated would be :
 (Note that each box represents statistically significant pathway (rectangles with dark black borders). Bigger the size, higher it's significance. Within each pathway (represented by rectangle with dark black border), genes are displayed by smaller rectangles (with lighter black border) and gene rectangle size is dependent on the statistically significant for each gene.
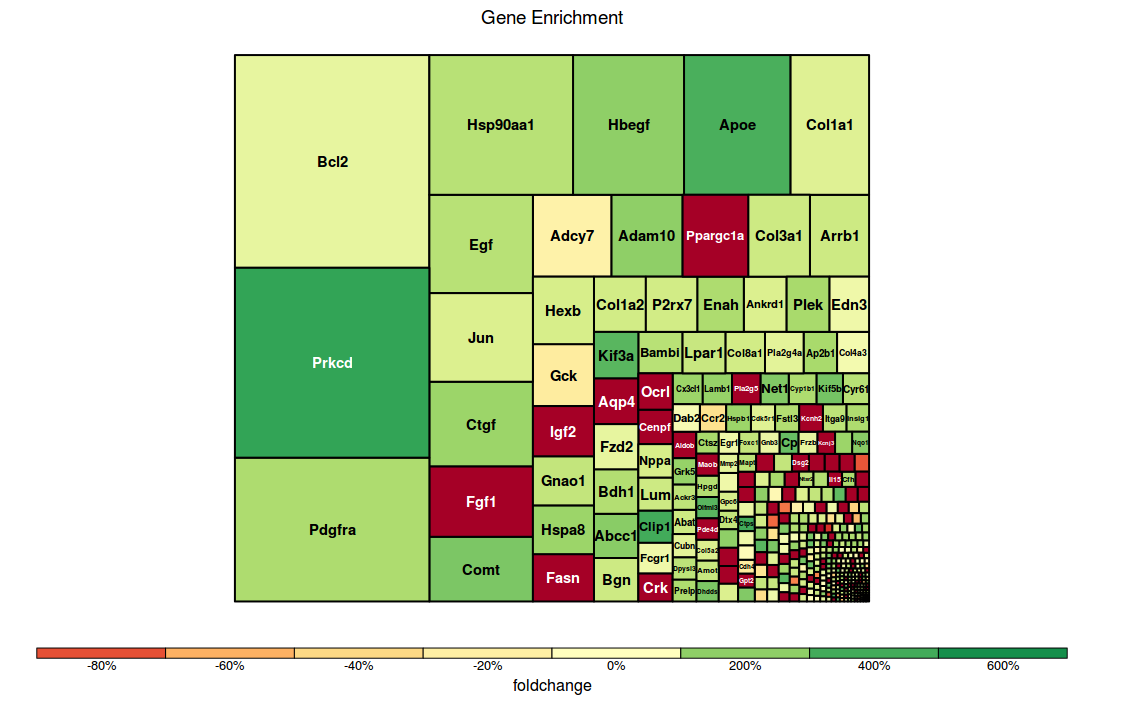
Scenario 2: User wants to see statistically significant genes
code:
$ treemap(tm, index="Genesymbol", type="comp", vSize="log_tttest", vColor="foldchange", title="Gene Enrichment")
Image generated would be :
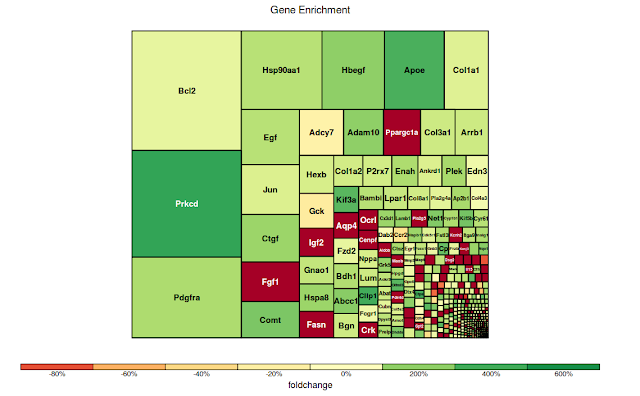 Note that rectangle size is dependent on the statistical significance of probes within that gene.
Scenario 3: User wants to see statistically significant pathways
code:
$ treemap(tm, index="pathway", type="comp", vSize="log_tttest", vColor="foldchange", title="Pathway Enrichment")

There are several options in Treemap. For eg. instead of relative scale, use can choose asbsolute scale for fold change or change the algorithm used in drawing the maps. Link to treemap package: http://cran.r-project.org/web/packages/treemap/index.html
Treemap consists of rectangles and rectangle size and color can be controlled. For eg. rectangle size can be number of genes in pathway and color can be their fold change. Larger the rectangular size, more is it's significance.
Minimal format for gene expression treemap is:
column 1: list of genes/entities whose p-values and fold changes are to displayed
column 2: log scaled significance values
Column 3: Fold change
here is an example file that can be downloaded from : https://drive.google.com/file/d/0B0MpwluEDxNublFydFdqNjd5djg/edit?usp=sharing
This file is obtained after analyzing the data from GSE8771 and columns in this file are: Probe, Genesymbol, foldchange, ttest, log_tttest, Biological process, pathway.
Requirements:
1) treemap package is installed in R/bioconductor
2) File mentioned above is, unzipped and loaded in R/bioconductor.
Code to load above file in R/bioconductor:
$ library(treemap)
$ tm=read.table("pw_en.txt", sep="\t", header=TRUE)
Scenario 1: User wants to see statistically significant pathway and genes within the pathway
code:
$ treemap(tm, index=c("pathway","Genesymbol"), type="comp", vSize="log_tttest", vColor="foldchange", title="Pathway Enrichment")
index = box should be drawn for which column(s)?
vSize = box size
vColor= box color
comp= relative scale
In the example, R/Bioc will draw most significant pathways and size of each rectangle is dependent on it's statistical score and color of the box is dependent on fold change of each gene.
Image generated would be :

Scenario 2: User wants to see statistically significant genes
code:
$ treemap(tm, index="Genesymbol", type="comp", vSize="log_tttest", vColor="foldchange", title="Gene Enrichment")
Image generated would be :
Scenario 3: User wants to see statistically significant pathways
code:
$ treemap(tm, index="pathway", type="comp", vSize="log_tttest", vColor="foldchange", title="Pathway Enrichment")

There are several options in Treemap. For eg. instead of relative scale, use can choose asbsolute scale for fold change or change the algorithm used in drawing the maps. Link to treemap package: http://cran.r-project.org/web/packages/treemap/index.html