One of the popular RNAseq data analysis workflow is Tuxedo workflow. This includes tophat (alignment), cufflinks (differential expression calculation for each transcriptional feature defined in reference file) and cummerbund (R package for visualization of data).
Tophat is a wrapper on "bowtie" aligner and supports both bowtie 1 and 2 versions. There are several options to fine tune the alignment and detailed options can be found here. Default options in Tophat are tailored for mammalian (mostly human) data analysis.
Next step post alignment is to feed tophat output (accepted_hits.bam) to cufflinks. Cufflinks is a suite of programs (when installed) that offers several independent steps. Cufflinks ( a program within cufflinks suite) does transript assembly (reference based). Cuffcompare allows the user to compare the assembled transcripts across samples with a known transcriptome (standard). Cuffcompare is an independent step and can be skipped if user decides to go forward with the results from cufflinks. Cuffmerge merges all the transcripts across all samples to build a master transcriptome (in addition to reference transcriptome provided by user) and this would be helpful in estimation of DE by cuffdiff. Cuffdiff involves quantification of expression levels (for gene, cds and exon), followed by comparison. Since quantification is computationally intensive, cuffquant is introduced to make quantification independent and for the ease of execution on cluster/cloud environments. One can skip cuffquant if there are no limitations on computational resources. Cuffnorm is recently introduced and so far literature is not available on its inner working. Hence at this point, it is better to avoid it. Cuffdiff program produces several output files and all the output files are well explained here (http://cole-trapnell-lab.github.io/cufflinks/cuffdiff/index.html). Since most of them are text files user can outright dive into results. However, a R program provided by same group allows the user to dissect and visualize results better.
Note provided here a bash script for entire tuxedo suite workflow (Tophat----> cufflinks----->cummerbund) embedding R script for visualization and extraction of significant genes/transcripts. Tuxedo workflow is summarized below:
Note provided here a bash script for entire tuxedo suite workflow (Tophat----> cufflinks----->cummerbund) embedding R script for visualization and extraction of significant genes/transcripts. Tuxedo workflow is summarized below:

There are certain steps that one can skip in tuxedo workflow. If one has defined transcriptome or into targeted sequencing such as panels, one need not go for cufflinks, cuffmerge steps. Please note that currently, panels are limited to WES or GWAS sequencing. Soon RNAseq panels may be used for clinical diagnosis. Cuffcompare can be skipped if user doesn't wish to compare sample transcriptomes. Cuffquant can be skipped, if user has no limitations on computational resources (and has enough time).
Workflow in current note follows steps given below:

Original files including raw reads (two groups: MeOH and R3H paired end reads, with 3 replicates), reference gtf and reference fasta can be downloaded here.
Download the raw files (12 fastqc files in total) and store them in a folder titled "raw_reads". Download fasta and gtf file and store them in a folder titled "reference". Run the following script. Please keep the r script file, raw_files folder and reference folder, in a single folder and run the script. Please note that I haven't used threads or core options for each program.
Please note that this a demo pipeline and user can customize as per individual data requirements. Cummerbund (R) allows user to dissect the several ways. R script provided here is a modified R script provided by package. R script is divided into 4 sections, major: 1) Operations on all the features (genes, TSS, CDS and isoforms) 2) Images and plots for all the features 3) Operations for few selected genes (user selected and top significant) 4) operations on random single gene. At the end, save the user workspace.
bash script for tuxedo workflow: (please note that I haven't used threads/cores option in any of the commands. Please use them as per hardware available)
==============================
Tuxedo workflow - script begins here
==============================
##Condition for each sample
for i in $(ls ./raw_reads | grep ^[^d]| rev | cut -c 10- | rev | uniq)
do
# Make direcotry for fastqc
#mkdir -p ${i%}_fastqc
# Run fastqc
#fastqc -o ./${i%}_fastqc -f fastq /home/suresh/rnaseq/raw_reads/${i%}_R1.fastq /home/suresh/rnaseq/raw_reads/${i%}_R2.fastq
# Make directory to store cutadapt results
#mkdir -p cutadapt
#Run cutadapt
#cutadapt -a AGATCGGAAGAGCGGTTCAGCAGGAATGCCGAGACCGATC --quality-cutoff=20 --format=fastq -o ./cutadapt/${i%}_R1.cutadapt.fastq -p ./cutadapt/${i%}_R2.cutadapt.fastq /home/suresh/rnaseq/raw_reads/${i%}_R1.fastq /home/suresh/rnaseq/raw_reads/${i%}_R2.fastq
# Run top hat and save the out with directory extension _tophatout
#tophat2 --no-update-check --no-coverage-search -o ./${i%}_tophat_out -G ./reference/genes_chr12.gtf -p 2 ./reference/chr12 ./cutadapt/${i%}_R1.cutadapt.fastq ./cutadapt/${i%}_R2.cutadapt.fastq --rg-id ${i} --rg-sample ${i%} --rg-library rna-seq --rg-platform Illumina
# Index the bam
#samtools index ./${i%}_tophat_out/accepted_hits.bam
# Collect the stats
#samtools flagstat ./${i%}_tophat_out/accepted_hits.bam > ./${i%}_tophat_out/accepted_hits.flastats
#Sort bam
#samtools sort -T /tmp/align.bam ./${i%}_tophat_out/accepted_hits.bam -o ./${i%}_tophat_out/accepted_hits.pos.sorted.bam
# Cufflinks to aseemble transcripts and quantifies expressed features (genes, transcripts, TSS and CDS)
#cufflinks -g ./reference/genes_chr12.gtf ./${i%}_tophat_out/accepted_hits.pos.sorted.bam --no-update-check -b ./reference/chr12.fa -o ${i%}_cuff_out/
# Cuffcompare to generate comparable transcripts wrt reference transciptome
#mkdir -p MeOH_R3G_cuffcompare_out
cuffcompare -o ./MeOH_R3G_cuffcompare_out/cuffcompare.out -r ./reference/genes_chr12.gtf -s ./reference/chr12.fa ${i%}_cuff_out transcripts.gtf
find | grep transcripts.gtf$ > ./MeOH_R3G_cuffcompare_out/gtf.list
# Cuffmerge to generate master transcriptome file for all the samples including matching reference transcriptome
mkdir -p .MeOH_R3G_cuffmerge_out/meoh_r3g
cuffmerge -o ./MeOH_R3G_cuffmerge_out/meoh_r3g -g ./MeOH_R3G_cuffcompare_out/cuffcompare.combined.gtf -s ./reference/chr12.fa ./MeOH_R3G_cuffcompare_out/gtf.list
# Cuffquant to quantify the counts
#cuffquant -o ./MeOH_R3G_cuffquant_out/ -p 2 --no-update-check -u -b ./reference/chr12.fa ./MeOH_R3G_cuffmerge_out/meoh_r3g/merged.gtf
# Cuffdiff to output differential expression
mkdir -p MeOH_R3G_cuffdiff_out
cuffdiff -L MeOH,R3G --multi-read-correct --no-update-check --FDR 0.1 -b ./reference/chr12.fa ./MeOH_R3G_cuffcompare_out/cuffcompare.combined.gtf -o ./MeOH_R3G_cuffdiff_out ./MeOH_REP1_tophat_out/accepted_hits.pos.sorted.bam,./MeOH_REP2_tophat_out/accepted_hits.pos.sorted.bam,./MeOH_REP3_tophat_out/accepted_hits.pos.sorted.bam ./R3G_REP1_tophat_out/accepted_hits.pos.sorted.bam,./R3G_REP2_tophat_out/accepted_hits.pos.sorted.bam,./R3G_REP3_tophat_out/accepted_hits.pos.sorted.bam
done
# Cummerbund script
Rscript cummerbund.R
==================================================
tuxedo workflow script ends here
==================================================
Please note that cuffquant command is muted as it is not mandatory step in work flow, in this example. R script, "cummerbund.R" ( a modified R script based on R script provided cummeRbund package)
==================================================
cummerbund.R script starts here
==================================================
rm(list=ls())
library(cummeRbund)
#-------------------------------
#read cufflinks files
#-------------------------------
setwd("./MeOH_R3G_cuffdiffout")
getwd()
cuff<-readCufflinks(gtfFile="../MeOH_R3G_cuffcompare_out/cuffcompare.combined.gtf", genome="hg19", rebuild=T)
#------------------------------
#Information about data
#-------------------------------
runInfo(cuff)
replicates(cuff)
sample.names<-samples(genes(cuff))
######All genes/isoforms/TSS/CDS operations################
#-----------------------------
#Calculate fpkm density distribution for genes for each group
#-----------------------------
g.dens<-csDensity(genes(cuff))
#-----------------------------
#Calculate fpkm density distribution for genes in each replicate in each group
#-----------------------------
r.g.dens<-csDensity(genes(cuff),replicates=T)
#-----------------------------
#Extract annotations for genes in cuff class
#-----------------------------
annot.g.c<-annotation(genes(cuff))
head(annot.g.c)
#-----------------------------
#Extract FPKM values for genes in cuff class
#-----------------------------
fpkm.g<-fpkm(genes(cuff))
head(gene.fpkm)
#-----------------------------
#Extract FPKM values for isoforms in cuff class
#-----------------------------
fpkm.iso<-fpkm(isoforms(cuff))
head(fpkm.iso)
#-----------------------------
#Extract replicate FPKM values for genes in cuff class
#-----------------------------
r.gene.repFpkm<-repFpkm(genes(cuff))
head(gene.repFpkm)
#-----------------------------
#Extract gene counts in cuff class
#-----------------------------
gene.counts<-count(genes(cuff))
head(gene.counts)
#-----------------------------
# Extract differntially regulated genes in cuff class
#-----------------------------
gene.diff<-diffData(genes(cuff))
head(gene.diff)
#--------------------------------------------------
# Extract features available for genes in cuff class db
#--------------------------------------------------
gene.featurenames<-featureNames(genes(cuff))
head(gene.featurenames)
#--------------------------------------------------
# Extract gene fpkm and store it as a matrix for all groups
#--------------------------------------------------
gene.matrix<-fpkmMatrix(genes(cuff))
head(gene.matrix)
#--------------------------------------------------
# Extract gene fpkm and store it as a matrix for all replicates in groups
#--------------------------------------------------
gene.rep.matrix<-repFpkmMatrix(genes(cuff))
head(gene.rep.matrix)
#--------------------------------------------------
# Extract normalized counts for genes and store as a matrix for all groups
#--------------------------------------------------
gene.count.matrix<-countMatrix(genes(cuff))
head(gene.count.matrix)
###############Plots and images##########################
#--------------------------------------------------
# Calculate heatmap distance for all the genes
#--------------------------------------------------
DistHeat<-csDistHeat(genes(cuff))
print(DistHeat)
#--------------------------------------------------
# Calculate heatmap distance for all the genes for all replicates
#--------------------------------------------------
RepDistHeat<-csDistHeat(genes(cuff),replicates=T)
print(RepDistHeat)
#--------------------------------------------------
# Plot component 1 and 2 in PCA plot for the genes
#--------------------------------------------------
genes.PCA<-PCAplot(genes(cuff),"PC1","PC2")
print(genes.PCA)
#--------------------------------------------------
# Plot component 1 and 2 in PCA plot for the genes for all the replicates
#--------------------------------------------------
genes.PCA.rep<-PCAplot(genes(cuff),"PC1","PC2",replicates=T)
print(genes.PCA.rep)
#--------------------------------------------------
# MDS Plot for the genes
#--------------------------------------------------
genes.MDS<-MDSplot(genes(cuff),2)
print(genes.MDS)
#--------------------------------------------------
# MDS Plot for the genes for all replicates
#--------------------------------------------------
genes.MDS.rep<-MDSplot(genes(cuff),replicates=T)
print(genes.MDS.rep)
#-------------------------------------
# Dispersion plot
#-------------------------------------
disp.plot<-dispersionPlot(genes(cuff))
png("../cummerbund/dispersionplot.png")
disp.plot
dev.off()
#-------------------------------------
# Squared coefficient of variance plots for genes
#-------------------------------------
genes.scv<-fpkmSCVPlot(genes(cuff))
png("../cummerbund/genescv.png")
genes.scv
dev.off()
#-------------------------------------
# Squared coefficient of variance plots for isoforms
#-------------------------------------
isoforms.scv<-fpkmSCVPlot(isoforms(cuff))
png("../cummerbund/isoformscv.png")
isoforms.scv
dev.off()
#-------------------------------------
# Plot FPKM densities for genes for each sample group
#-------------------------------------
png("../cummerbund/genedensity.png")
g.dens
dev.off()
#-------------------------------------
# Plot FPKM densities for genes in each replicate
#-------------------------------------
png("../cummerbund/genedensity_replicates.png")
r.g.dens
dev.off()
#-------------------------------------
#Box plots for data distribution per group
#------------------------------------
b<-csBoxplot(genes(cuff))
png("../cummerbund/boxplot.png")
b
dev.off()
#-------------------------------------
#Box plots for data distribution in all replicates
#------------------------------------
brep<-csBoxplot(genes(cuff),replicates=T)
png("../cummerbund/boxplot_rep.png")
brep
dev.off()
#------------------------------------
#All groups against all Scatter plot for genes
#------------------------------------
s<-csScatterMatrix(genes(cuff))
print(s)
png("../cummerbund/gene_scatterplotplot.png")
s
dev.off()
#------------------------------------
# Two groups against each other Scatter plot for genes
#------------------------------------
s<-csScatter(genes(cuff),"MeOH","R3G",smooth=T)
s
png("../cummerbund/gene_scatterplotplot1.png")
s
dev.off()
#------------------------------------
# Dendrogram plot for each group
#------------------------------------
dend<-csDendro(genes(cuff))
plot(dend)
#------------------------------------
# Dendrogram plot for all the replicates
#------------------------------------
dend.rep<-csDendro(genes(cuff),replicates=T)
plot(dend.rep)
#------------------------------------
# Fold change (M) Vs Foldchange (A) plots for two groups
#------------------------------------
m<-MAplot(genes(cuff),"MeOH","R3G")
m
#------------------------------------
# Fold change (M) Vs counts (A) plots for two groups
#------------------------------------
mCount<-MAplot(genes(cuff),"MeOH","R3G",useCount=T)
mCount
#------------------------------------
# Fold change (M) Vs Pvalue (volcano) plots for all groups against all
#------------------------------------
v<-csVolcanoMatrix(genes(cuff))
v
#------------------------------------
# Fold change (M) Vs Pvalue (volcano) plots for two groups
#------------------------------------
v<-csVolcano(genes(cuff),"MeOH","R3G")
v
##########Filtered genes/isoforms/TSS/CDS operations########
#--------------------------------------------------
# Extract significantly expressed genes
#--------------------------------------------------
SigTable<-getSigTable(cuff,alpha=0.01,level='genes')
head(SigTable,20)
#--------------------------------------------------
# Plot significant genes with 5% FDR across all groups
#--------------------------------------------------
SigMat<-sigMatrix(cuff,level='genes',alpha=0.05)
print(SigMat)
#--------------------------------------------------
# Extract significant gene IDs with 5% FDR across all groups
#--------------------------------------------------
SigGeneIds<-getSig(cuff,alpha=0.05,level='genes')
head(SigGeneIds)
length(SigGeneIds)
#--------------------------------------------------
# Extract significant genes using IDs with 5% FDR across all groups
#--------------------------------------------------
SigGenes<-getGenes(cuff,SigGeneIds)
SigGenes
#--------------------------------------------------
# Extract significant isoform IDs with 5% FDR between two groups
#--------------------------------------------------
MeOH_vs_R3G.sigIsoformIds<-getSig(cuff,x='MeOH',y='R3G',alpha=0.05,level='isoforms')
head(MeOH_vs_R3G.sigIsoformIds)
length(MeOH_vs_R3G.sigIsoformIds)
##########Selected genes/isoforms/TSS/CDS operations############
#--------------------------------------------------
# Extract first 20 genes with 5% FDR between two groups
#--------------------------------------------------
head(SigGeneIds,20)
myGeneIds<-head(SigGeneIds,20)
myGeneIds
myGenes<-getGenes(cuff,myGeneIds)
myGenes
#--------------------------------------------------
# Extract genes between two conditions
#--------------------------------------------------
myGeneset.pluri<-getGenes(cuff,myGeneIds,sampleIdList=c("MeOH","R3G"))
myGeneset.pluri
#--------------------------------------------------
# Extract gene FPKM values for first 20 genes with 5% FDR between two groups
#--------------------------------------------------
#FPKM values for genes in gene set
head(fpkm(myGenes))
#--------------------------------------------------
# Extract isoform FPKM values for first 20 genes with 5% FDR between two groups
#--------------------------------------------------
head(fpkm(isoforms(myGenes)))
#--------------------------------------------------
# Extract TSS FPKM values for first 20 genes with 5% FDR between two groups for all replicates
#--------------------------------------------------
head(repFpkm(TSS(myGenes)))
#--------------------------------------------------
# Heatmap for gene FPKMs for two groups
#--------------------------------------------------
h<-csHeatmap(myGenes,cluster='both')+theme_bw()
h
#--------------------------------------------------
# Heatmap for gene FPKMs for all replicates within groups
#--------------------------------------------------
h.rep<-csHeatmap(myGenes,cluster='none',replicates=T)+theme_bw()
h.rep
#--------------------------------------------------
# Bar plot for selected differentially expressed genes
#--------------------------------------------------
b<-expressionBarplot(myGenes)
b
#--------------------------------------------------
# Scatter plot for selected differentially expressed genes
#--------------------------------------------------
s<-csScatter(myGenes,"MeOH","R3G",smooth=T)
s
#--------------------------------------------------
# Volcano plot for selected differentially expressed genes
#--------------------------------------------------
v<-csVolcano(myGenes,"MeOH","R3G")
v
#--------------------------------------------------
# Heatmap for isoforms from selected differentially expressed genes
#--------------------------------------------------
ih<-csHeatmap(isoforms(myGenes),cluster='both',labRow=F)
ih
#--------------------------------------------------
# Heatmap for TSS from selected differentially expressed genes
#--------------------------------------------------
th<-csHeatmap(TSS(myGenes),cluster='both',labRow=F)
th
#--------------------------------------------------
# Dendrogram plot for selected differentially expressed genes
#--------------------------------------------------
den<-csDendro(myGenes)
plot(den)
#--------------------------------------------------
# Calcualte partitions using K-means clustering for selected genes
#--------------------------------------------------
ic<-csCluster(myGenes,k=4)
head(ic$cluster)
#--------------------------------------------------
# Plot partitions using K-means clustering for selected genes
#--------------------------------------------------
icp<-csClusterPlot(ic)
icp
#--------------------------------------------------
# Calcualte condition specificity for selected genes
#--------------------------------------------------
myGenes.spec<-csSpecificity(myGenes)
head(myGenes.spec)
#########Single gene/isoform/TSS/CDS operations#########################
#--------------------------------------------------
# Extract information for a single gene
#--------------------------------------------------
myGeneId<-"KLRD1"
myGene<-getGene(cuff,myGeneId)
#--------------------------------------------------
# View available information for a stored single gene information
#--------------------------------------------------
View(features(myGene))
head(features(myGene))
#--------------------------------------------------
# View first few FPKM values for selected gene and isoforms within that gene
#--------------------------------------------------
head(fpkm(myGene))
head(fpkm(isoforms(myGene)))
#--------------------------------------------------
# Plot expression for the selected gene
#--------------------------------------------------
gl<-expressionPlot(myGene)
gl
#--------------------------------------------------
# Plot expression for the selected gene in all replicates
#--------------------------------------------------
gl.rep<-expressionPlot(myGene,replicates=TRUE)
gl.rep
#--------------------------------------------------
# Plot expression for isoforms within selected gene in all replicates
#--------------------------------------------------
gl.iso.rep<-expressionPlot(isoforms(myGene),replicates=T)
gl.iso.rep
#--------------------------------------------------
# Plot expression for isoforms within selected gene in all replicates
#--------------------------------------------------
gl.cds.rep<-expressionPlot(CDS(myGene),replicates=T)
gl.cds.rep
#--------------------------------------------------
# Expression barplot for selected gene
#--------------------------------------------------
gb<-expressionBarplot(myGene)
gb
#--------------------------------------------------
# Expression barplot for selected gene in all replicates
#--------------------------------------------------
gb.rep<-expressionBarplot(myGene,replicates=T)
gb.rep
#--------------------------------------------------
# Expression barplot for isoforms within selected gene in all replicates
#--------------------------------------------------
igb<-expressionBarplot(isoforms(myGene),replicates=T)
igb
#--------------------------------------------------
# Piechart for isoforms in selected gene
#--------------------------------------------------
gp<-csPie(myGene,level="isoforms")
gp
#---------------------------------------
#Extract similarly expressed genes that are similar to user defined gene
#---------------------------------------
mySimilar<-findSimilar(cuff,"ALKBH2",n=20)
mySimilar.expression<-expressionPlot(mySimilar,logMode=T,showErrorbars=F)
print(mySimilar.expression)
#---------------------------------------
#Extract similarly expressed genes that are similar to user defined profile
#---------------------------------------
myProfile<-c(500,0,400)
mySimilar2<-findSimilar(cuff,myProfile,n=10)
mySimilar2.expression<-expressionPlot(mySimilar2,logMode=T,showErrorbars=F)
print(mySimilar2.expression)
#------------------
# Disconnect cuff database that is been in use (only at the end)
#------------------
end<-dbDisconnect(cuff@DB)
dbConnect(cuff@DB)
#--------------------------------
# Print loaded packages and their versions used in this analysis
#---------------------------------
sessionInfo()
save.image("cummerbund.Rdata")
==============================================================
cummerbund.R script ends here
==============================================================
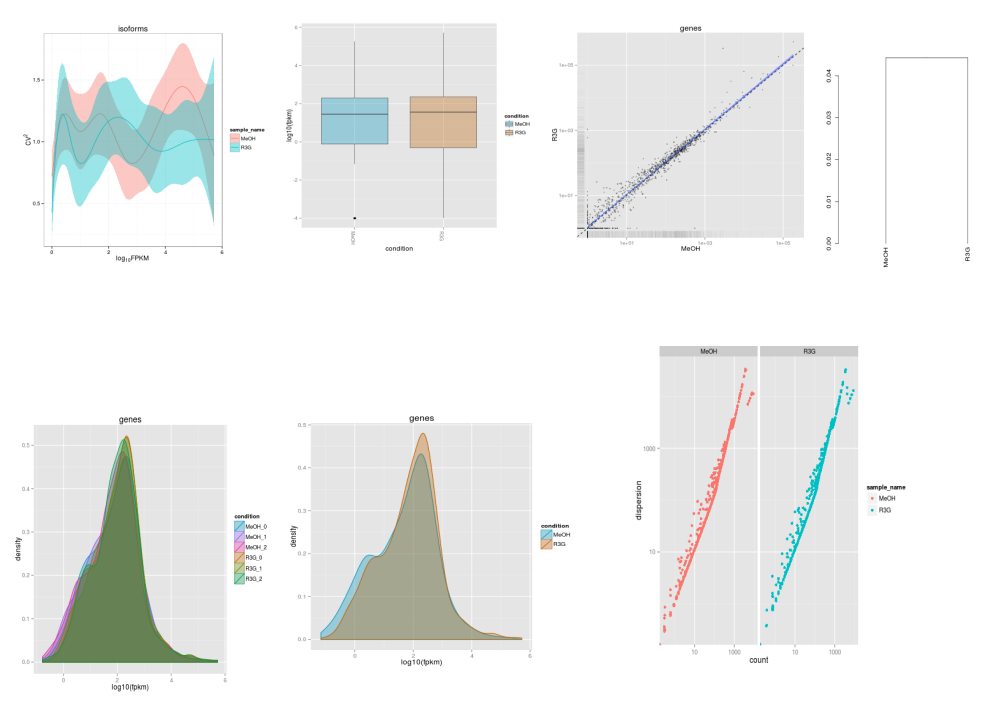
Few of the plots are collated here: