In biology, some times you end up with data that is not easy to deal with. Look at the following data and it can be downloaded from here.
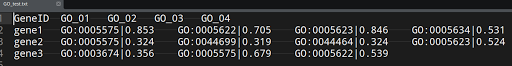
As you would see first column is gene name, the rest 4 columns are GO (gene ontology) columns. Each column has two components, separated by "|". First component is GO term ID (identifier) and second half is a score (let us say adjusted p-value). Now for each gene, I would like to take the GO term with maximum score.
Let us have a look at the code and output from the code:
-------------------------------------------------------------------------------------------------
> test=read.csv("GO_test.txt", header = T, sep = "\t", strip.white = T, na.strings = "")
> test
> test
GeneID GO_01 GO_02 GO_03
1 gene1 GO:0005575|0.853 GO:0005622|0.705 GO:0005623|0.846
2 gene2 GO:0005575|0.324 GO:0044699|0.319 GO:0044464|0.324
3 gene3 GO:0003674|0.356 GO:0005575|0.679 GO:0005622|0.539
GO_04
1 GO:0005634|0.531
2 GO:0005623|0.524
3 <NA>
1 gene1 GO:0005575|0.853 GO:0005622|0.705 GO:0005623|0.846
2 gene2 GO:0005575|0.324 GO:0044699|0.319 GO:0044464|0.324
3 gene3 GO:0003674|0.356 GO:0005575|0.679 GO:0005622|0.539
GO_04
1 GO:0005634|0.531
2 GO:0005623|0.524
3 <NA>
> cbind("GeneID"=test[,1],"GO-term"=apply(test[,-1],1, function(x) x[order(as.numeric(sub("\\D+\\d+\\D","",x)),decreasing = T)][1]))
GeneID GO-term
[1,] "gene1" "GO:0005575|0.853"
[2,] "gene2" "GO:0005623|0.524"
[3,] "gene3" "GO:0005575|0.679"
[1,] "gene1" "GO:0005575|0.853"
[2,] "gene2" "GO:0005623|0.524"
[3,] "gene3" "GO:0005575|0.679"
-------------------------------------------------------------------------------------------------